Management Indices
Management Indices
| 2021/3 |
2022/3 |
2023/3 |
2024/3 |
2025/3 |
|
|---|---|---|---|---|---|
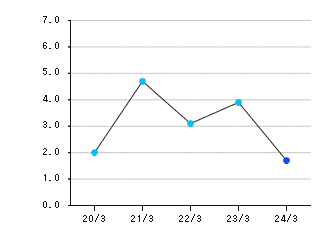
| Return on Assets (ROA)【%】 | 4.7 | 3.1 | 3.9 | 1.7 | 1.3 |
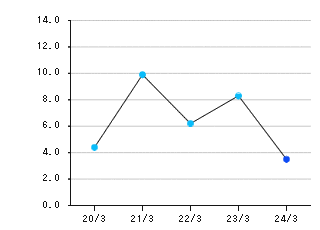
| Return on Equity (ROE)【%】 | 9.9 | 6.2 | 8.3 | 3.5 | 2.5 |
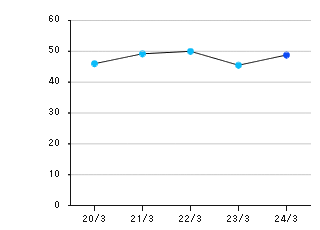
| Shareholders' Equity Ratio【%】 | 49.2 | 50.0 | 45.5 | 48.8 | 52.7 |
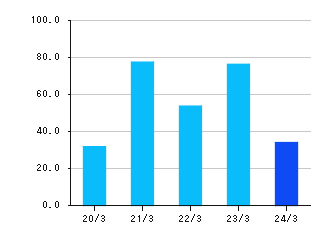
| Net Income per Share【yen】 | 77.50 | 53.71 | 76.35 | 34.03 | 24.62 |
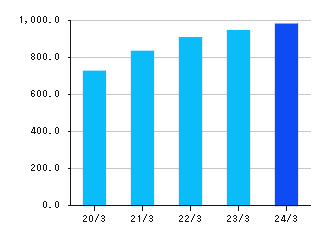
| Net Assets per Share【yen】 | 833.38 | 906.61 | 943.96 | 980.15 | 994.97 |
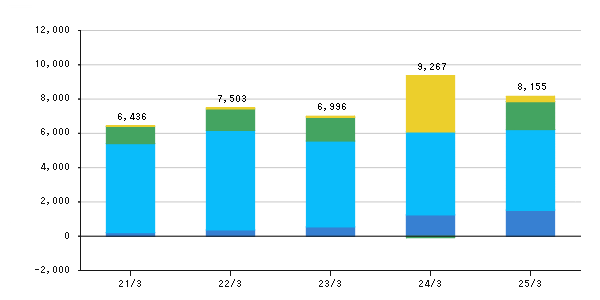
Capital Expenditure (Non-consolidated)
(millions of yen)
| 2021/3 |
2022/3 |
2023/3 |
2024/3 |
2025/3 |
|
|---|---|---|---|---|---|
| Production Infrastructure | 213 | 371 | 549 | 1,248 | 1,526 |
| Supply Infrastructure | 5,193 | 5,808 | 5,007 | 4,839 | 4,699 |
| Service and Maintenance Facilities and Other Facilities | 1,002 | 1,250 | 1,390 | △81 | 1,627 |
| Facilities for Incidental Businesses | 28 | 74 | 50 | 3,261 | 303 |
| Total | 6,438 | 7,504 | 6,998 | 9,268 | 8,156 |
■Facilities for Incidental Businesses
■Service and Maintenance Facilities and Other Facilities
■Supply Infrastructure
■Production Infrastructure
(millions of yen)
