Financial Highlights
Consolidated
(millions of yen)
| 2021/3 |
2022/3 |
2023/3 |
2024/3 |
2025/3 |
|
|---|---|---|---|---|---|
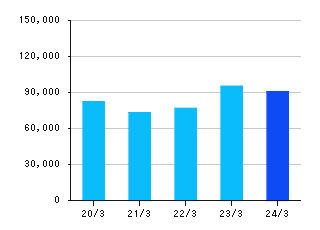
| Net Sales | 73,250 | 76,802 | 95,219 | 90,670 | 91,595 |
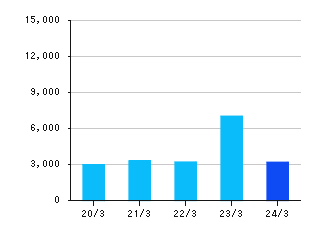
| Operating Income | 3,293 | 3,207 | 7,021 | 3,185 | 1,252 |
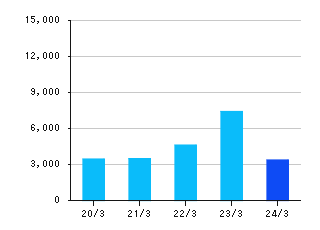
| Ordinary Income | 3,467 | 4,616 | 7,412 | 3,375 | 1,909 |
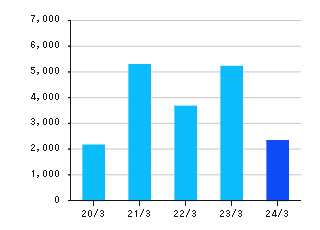
| Profit Attributable to Owners of Parent | 5,272 | 3,662 | 5,216 | 2,329 | 1,687 |
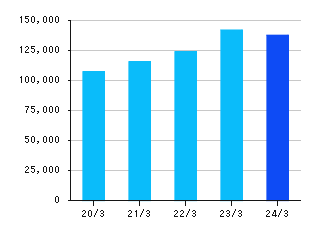
| Total Assets | 115,477 | 123,802 | 141,996 | 137,628 | 129,593 |
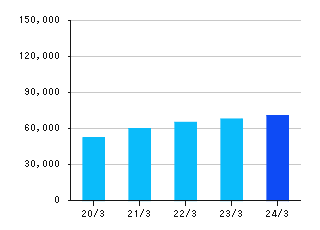
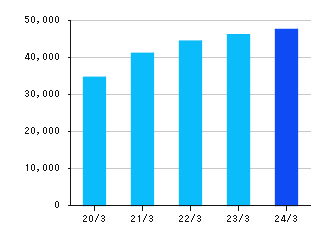
| Net Assets | 59,805 | 65,067 | 67,860 | 70,512 | 71,592 |
Non-consolidated
(millions of yen)
| 2021/3 |
2022/3 |
2023/3 |
2024/3 |
2025/3 |
|
|---|---|---|---|---|---|
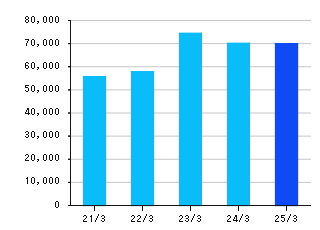
| Total Net Sales | 55,717 | 57,818 | 74,491 | 70,169 | 70,010 |
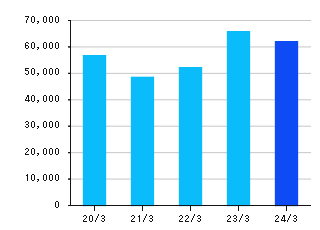
| Gas Sales | 48,500 | 52,173 | 65,683 | 61,896 | 60,792 |
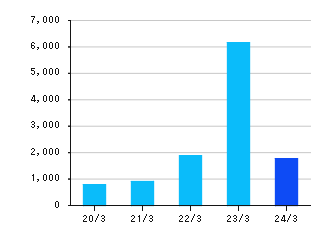
| Operating Income | 906 | 1,876 | 6,156 | 1,767 | △5 |
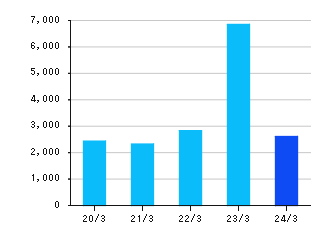
| Ordinary Income | 2,326 | 2,830 | 6,851 | 2,610 | 1,052 |
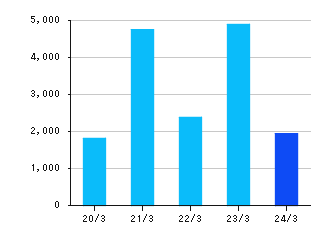
| Net Income | 4,752 | 2,381 | 4,893 | 1,941 | 1,141 |
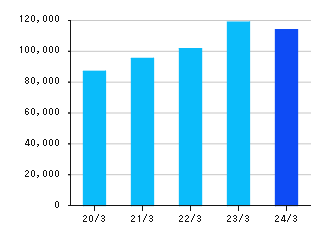
| Total Assets | 95,408 | 101,769 | 118,944 | 113,874 | 104,261 |
| Net Assets | 41,152 | 44,445 | 46,192 | 47,596 | 47,713 |
